1NAVIGATORFind & load data
2VIEWVisualise data
3ANALYSISCompute on data
4REPORTDocument findings
5SCRIPTAutomate & extend
Kanalysis advantage
Parity
DIAdem advantage / Kanalysis gap
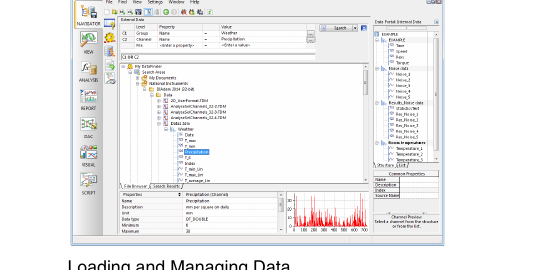
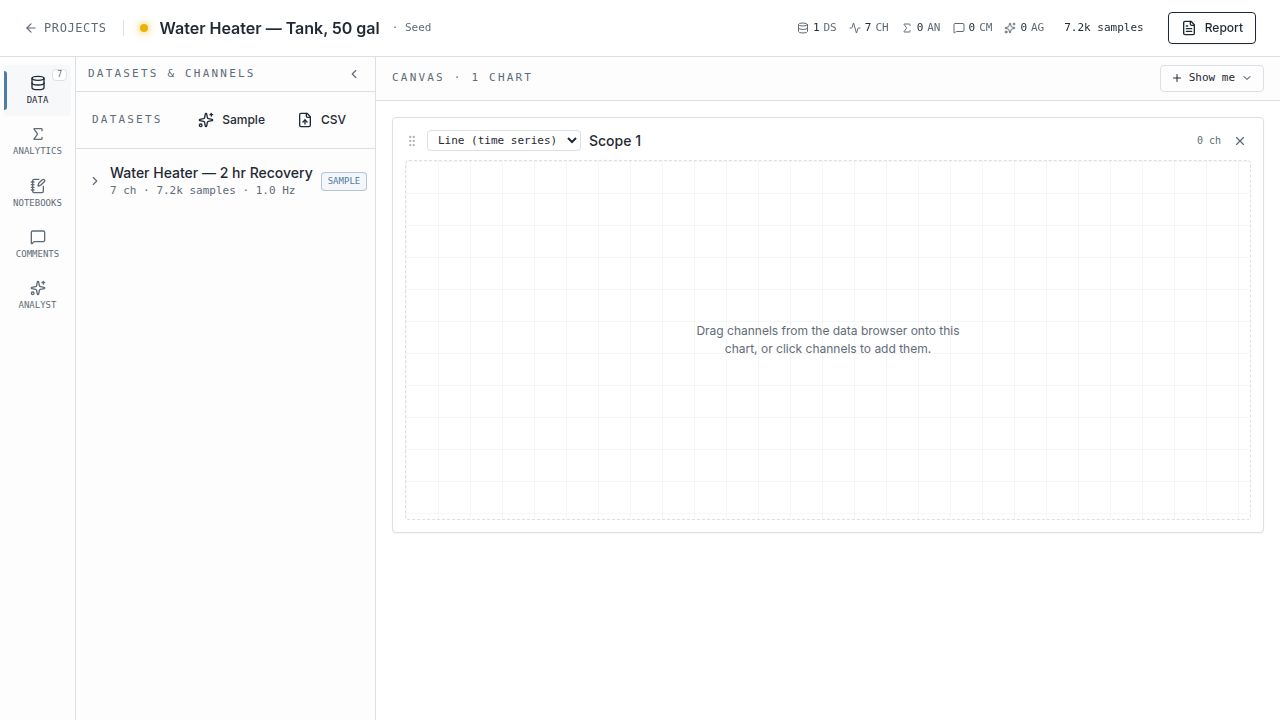
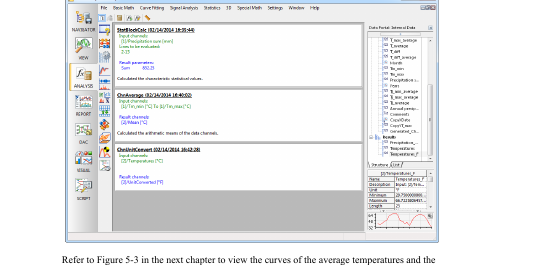
DIAdem's NAVIGATOR is where engineers locate measurement files, browse channels, and pull them into the Data Portal.
Kanalysis exposes the same workflow through the EXPLORE rail: server-backed projects, expandable dataset → channel trees, and a CSV/sample importer, minus the Windows file picker.
| Capability | DIAdem NAVIGATOR | Kanalysis DATA |
|---|---|---|
| Data source | Local files via DataPlugins (TDM, TDMS, CSV, ASCII, custom binary). | Server-backed projects + CSV / JSON / Parquet / Excel / TDMS / MF4 / MAT / HDF5 / WAV / CH10 import, Vector ASC / BLF CAN logs with DBC decode, ARINC-429 / IENA / UFF58 / EDF / WFDB / BACnet CSV industry formats, battery cycler text exports, custom Python data plugins, and curated sample presets. Beyond DataPlugins |
| Channel browsing | Tree under "Data Portal"; expand group → channels. | Same expand-to-channel tree, scoped per dataset, with per-channel unit + sample-rate hint inline. Parity |
| Property inspector | Bottom pane shows channel name/desc/unit/min/max + thumbnail curve. | Channel min/max/unit live in the chart legend; preview is the full chart, not a thumbnail. Parity |
| Quick search | "Search" box queries file content via indexed metadata. | In-app channel filter; cross-project search not yet built. DIAdem ahead |
| Layout | Fixed three-pane layout; panels toggle via menu. | Side panel collapses with a chevron to give the canvas full width. Kanalysis advantage |
| Workspace concept | Single-user desktop; project = folder of files. | Server-backed project: datasets, analyses, comments, notebooks, agent runs persist together. Multi-user ready |
2.VIEW
Visualise & evaluate data
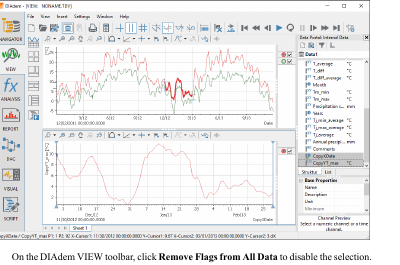
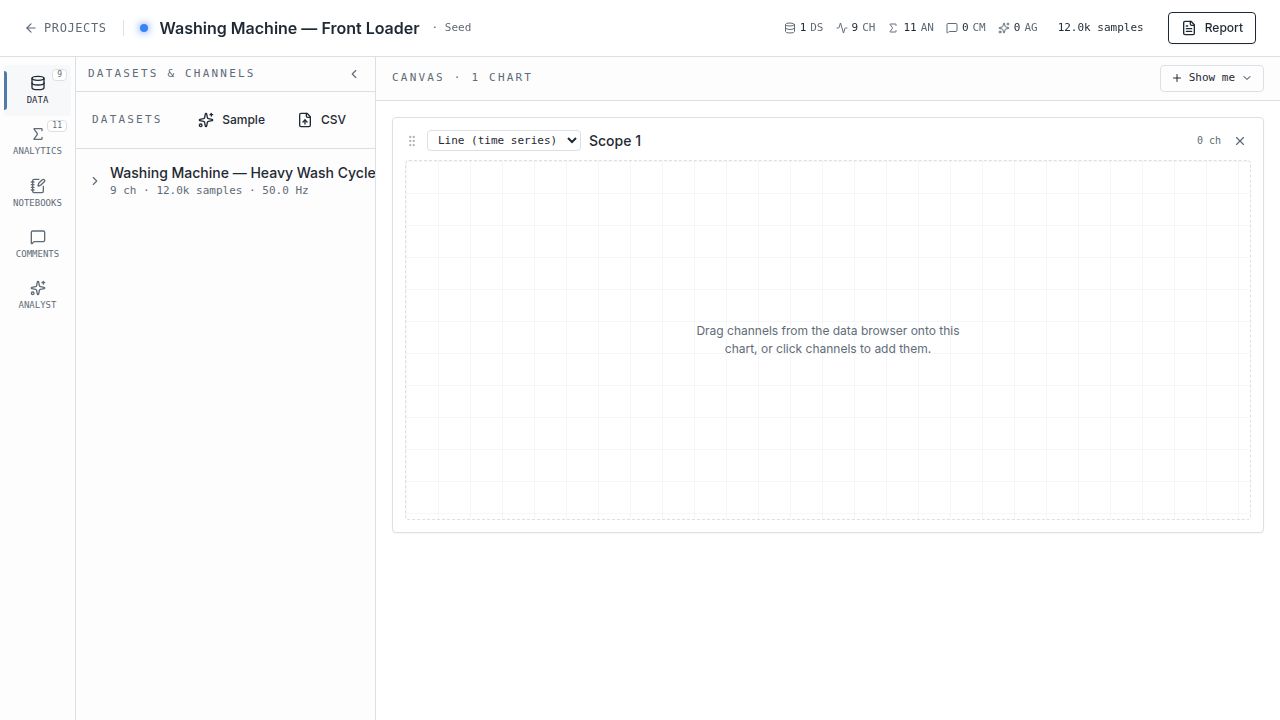
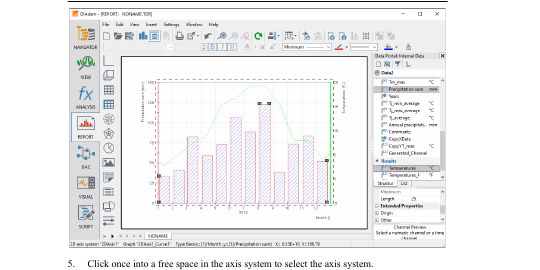
DIAdem's VIEW module is the inspection canvas, drop channels onto axis systems, scrub with cursors, copy regions back to the Data Portal.
Kanalysis uses a stacked-pane CANVAS: each pane is an independent chart you configure via the "Show me" picker, with click-to-anchor comments standing in for cursors.
| Capability | DIAdem VIEW | Kanalysis CANVAS |
|---|---|---|
| Layout model | Worksheet grid; user drops "areas" into fixed cells. | Stacked dashboard of independent panes; "Show me" picker chooses pane type. Lower friction |
| Chart types | 2D axis, 3D, polar, waterfall, FFT, table, bar, contour, ~30 total. | 9 live: line, X-Y scatter, histogram, bar, area, heatmap, FFT magnitude, spectrogram, box plot. 3D / polar / waterfall still pending. Parity for the common 9 |
| Adding channels | Drag from Data Portal onto axis system. | Click or drag from the EXPLORE rail; same model. Parity |
| Y-axis scaling | Per-channel autoscale, manual override. | Real tick labels in channel units (single-channel) or 0–100% normalised (multi-channel) + per-channel min/max in the legend. Parity |
| Cursors / regions | Single + dual cursor, region select, copy-to-portal. | Click-to-anchor comments tied to a time range; cursor read-out shown in chart header. Parity, different idiom |
| Modal UX | Opaque dialogs cover the chart. | Translucent modal (20% foreground tint + backdrop blur) keeps the chart visible while configuring. Kanalysis advantage |
3.ANALYSIS
Compute on data
DIAdem's ANALYSIS module is the function library: statistics, DSP, curve fit, peak find, channel math, and a calculator for custom formulas, all logged to a calculation history.
Kanalysis exposes the same surface through the ANALYSE rail, an 86-tile catalogue mirroring the DIAdem groups, of which 37 are wired end-to-end today (the rest are visible as roadmap tiles), plus an inline math-channel formula bar.
| Capability | DIAdem ANALYSIS | Kanalysis ANALYTICS |
|---|---|---|
| Function library | ~75 functions across Basic Math, Curve Fitting, Signal Analysis, Statistics, 3D, Special Math, Channel Functions. | 86-tile catalogue mirroring the DIAdem groups; 37 wired end-to-end today (descriptive stats, histogram + quantiles + moments, correlation, the 10-tile event-detection toolkit, FFT / PSD / spectrogram / autocorrelation / Hilbert, low/high/band/bandstop filters, normalize / rectify / invert, linear + polynomial regression, trim / drift / events / zero-crossings, key channel ops). Rest are visible as roadmap tiles. Half the DIAdem library, live |
| Event detection | Toolkit: EventDetectionWindow, EventCount, EventStat*, EventCopyValues, EventCreateFilteredTrueChn, ChnLength, ChnGet. |
Same 10-tile group, neutral naming, runs in-browser against any channel. Parity |
| Result channels | Calculations write new channels into the Data Portal, with a calculation log of every step. | Outputs land back in the dataset with an "fx" badge, plus a per-analysis card with parameters and result snippet. Parity |
| Math channels | Calculator window with formula syntax: Ch("Results/X")=Ch("[1]/Tm_max")-Ch("[2]/Temperatures"). |
Formula bar with mini DSL: rms, mean, derivative, integrate, lowpass, highpass, fft_mag, etc.; result appears in the data browser instantly. Inline, no modal |
| Run UX | Each function opens a dialog that hides the chart while you fill inputs. | Modal is translucent so the chart stays visible while you configure inputs. Kanalysis advantage |
| Calculation manager | Defines reusable calculation sequences (chained steps with parameters). | Not built as a dedicated manager, chained calculations are typically scripted in a notebook. DIAdem ahead |
4.REPORT
Document & share findings
DIAdem's REPORT module is a print-oriented page designer: drag axis systems, tables, text boxes, and graphics onto a worksheet, then export to PDF.
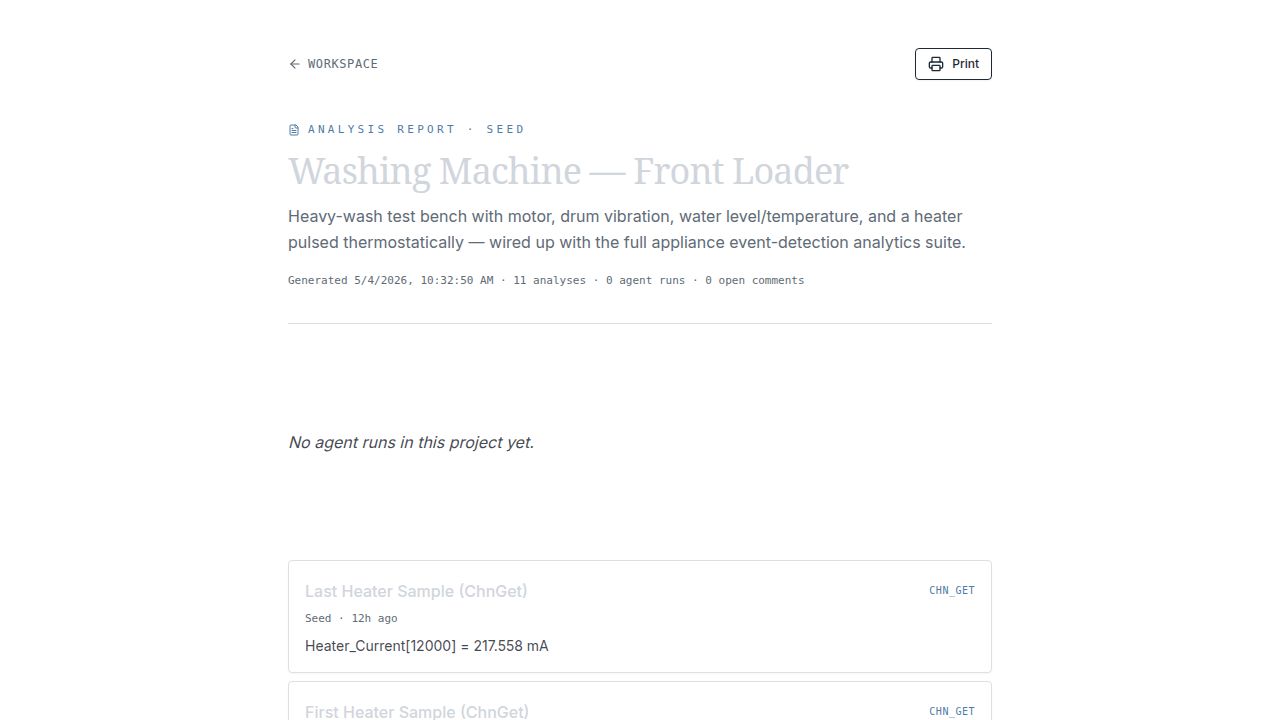
Kanalysis has a single curated Report page that aggregates analyses, agent runs, and comments, print-friendly, but a fixed layout rather than free-form drag-and-drop.
| Capability | DIAdem REPORT | Kanalysis REPORT |
|---|---|---|
| Layout | Free-form worksheet, axis systems, text, tables, lines, images placed anywhere, multiple pages. | Block-based builder: add / reorder / delete blocks of kind text (markdown), chart, channel-stats table, KPI, aggregated analyses, aggregated comments. Layout persists per project. Block parity, single page |
| Variables in text | Custom property syntax (@@Str(Data.GetChannel(...).Properties("...").Value,"AutoAdj")@@) interpolates channel values into labels. |
Analysis results render with their numeric output baked in (Heater_Current[12000] = 217.558 mA). Parity, simpler model |
| Chart wizard | Step-through Chart Wizard picks diagram type, axes, ranges, sub-types. | Charts are configured upstream in CANVAS; the report shows the chosen views. Different workflow |
| Reuse | "Save Layout As" stores a worksheet as a TDR template re-applicable to similar data sets. | Same project structure across datasets; templates not yet a separate concept. DIAdem ahead |
| Output | Print, PDF export, image export. | Browser Print → PDF via the Print button. Parity |
| Collaboration | Send the TDR file. | Project URL; anchored comments thread alongside the report. Web-native |
| Edit history & undo | Manual Ctrl+Z inside the report designer; no audit trail. | Every mutating action (manual or AI) writes a structured activity row; the AI Analyst dock shows a one-click Undo on each step, and soft-deleted report blocks are hard-purged after 7 days so retention is bounded. Kanalysis advantage |
5.SCRIPT
Automate & extend
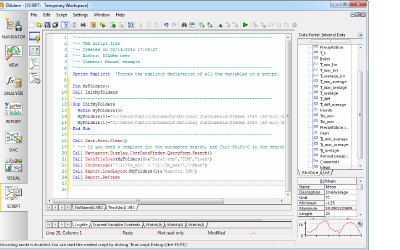
DIAdem's SCRIPT module is a VBScript editor with line numbers, watch panes, and a macro recorder that captures user actions as code.
Kanalysis replaces it with NOTEBOOKS (Pyodide cells running in the browser) plus an AI Analyst agent panel, modern stack, no recorder.
| Capability | DIAdem SCRIPT | Kanalysis NOTEBOOKS / ANALYST |
|---|---|---|
| Language | VBScript with the NI-DIAdem object model (Call DataFileLoad(...), Call Navigator.OpenSeq(...)). |
Python via Pyodide, with a chronos SDK that exposes dataset and channels. Modern stack |
| Editor | Single-file script editor with line numbers, current-variable view, watch. | Notebook with multiple cells, in-cell text + matplotlib PNG output. Notebook idiom |
| Library access | VBScript stdlib + DIAdem Calls library. | Full numpy / scipy / pandas / matplotlib via Pyodide. Kanalysis advantage |
| Macro recorder | Records user actions as VBScript for later replay. | Not implemented, the AI Analyst plans & executes investigations against the dataset instead. DIAdem ahead in recording, Kanalysis ahead in agency |
| Execution model | Runs locally in the DIAdem process; can call DataPlugins, COM, .NET. | Runs in the browser sandbox (Pyodide); no native I/O, but no install required. Different trade-off |
| Discoverability | Object-model docs in the help system. | SDK exposed through autocomplete + the AI agent that already knows the API. Kanalysis advantage |
| Undo agent actions | N/A (no agent). | Each AI Analyst tool call records a server-side activity row with the inverse mutations; the dock renders an Undo button on the corresponding step. The undo route runs the same agent_undo_call tool the agent uses, with editor-role + cross-tenant guards. Kanalysis advantage |
At a glance
Roll-up across all five modules| Dimension | DIAdem | Kanalysis |
|---|---|---|
| Era / stack | Win32 desktop, ~2003 design language | Web app, React 19 + Vite 7 + Tailwind v4 |
| Install | Multi-GB MSI, Windows-only | Browser; nothing to install |
| Five-module map | NAVIGATOR / VIEW / ANALYSIS / REPORT / SCRIPT | DATA / CANVAS / ANALYTICS / REPORT / NOTEBOOKS, same 1-to-1 mapping, plus a sixth ANALYST agent rail |
| Analytics coverage | ~75 built-ins | 86-tile catalogue mirroring DIAdem; 37 wired end-to-end today (incl. full event-detection toolkit, FFT/PSD/spectrogram, IIR filters, regression) + math-channel formula bar; rest visible as roadmap tiles |
| Visualisation | Worksheet / area model, ~30 chart types | Stacked panes; 9 chart types live (line, X-Y, histogram, bar, area, heatmap, FFT, spectrogram, box); collapsible side panel for full-width plots |
| Import formats | TDM / TDMS / CSV / ASCII / custom binary via DataPlugins (~150 plugins) | CSV / JSON / Parquet / Excel / TDMS / MF4 / MAT / HDF5 / WAV / CH10, Vector ASC / BLF CAN logs, ARINC-429 / IENA / UFF58 / EDF / WFDB / BACnet CSV, battery cycler text exports, custom Python data plugins, curated sample presets |
| Report builder | Free-form multi-page worksheet, TDR templates | Block-based single-page builder: text / chart / table / KPI / analyses / comments, add, reorder, delete, persisted per project |
| Extensibility | VBScript + DataPlugins (C/C++) | Python notebooks, OpenAPI-first server, math-channel DSL |
| Collaboration | File hand-off (TDM, TDR) | Real-time projects, anchored comments, AI agent |
| Modal UX | Opaque dialogs cover the chart | Translucent dialogs keep the chart visible |